Training Course on Advanced Excel (DMC004)
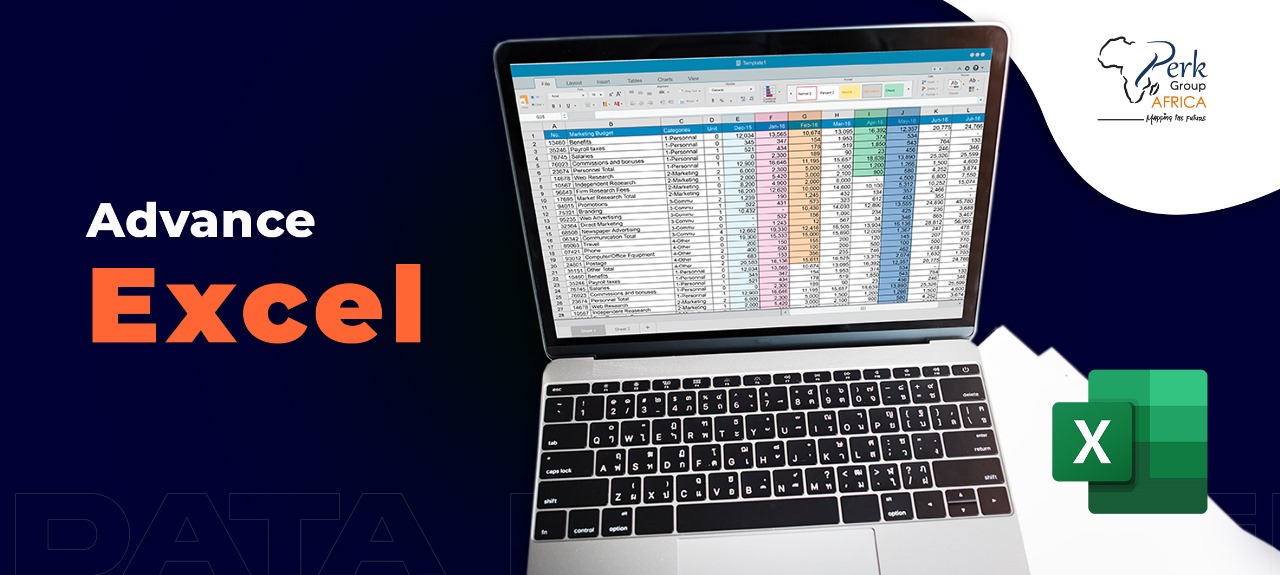
Training Course on Advanced Excel
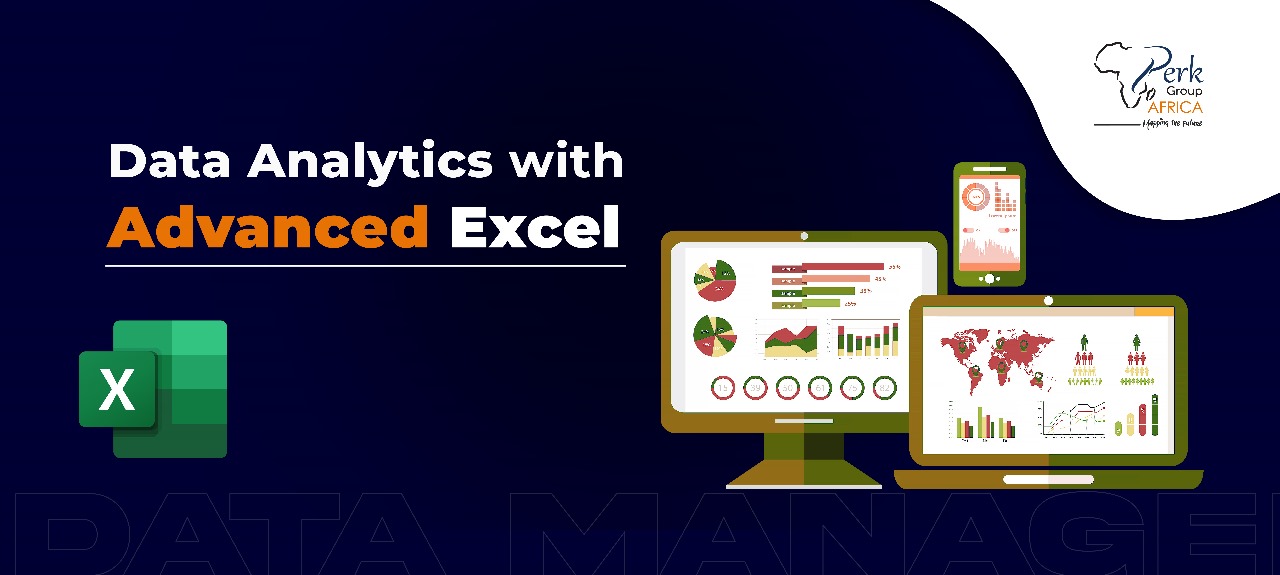
This Advanced Excel course offers a practical approach to mastering the advanced features and functionalities of Microsoft Excel.
Through a combination of hands-on exercises, real-world examples, and advanced techniques, participants will explore the powerful capabilities of Excel. They will learn how to effectively analyze complex data sets, automate tasks with macros, create dynamic reports and dashboards, and utilize advanced functions and formulas.
This course is designed for individuals who already have a solid foundation in Excel and want to elevate their skills to an advanced level.
Course Duration
Online Training: 7 days (4hrs per day)
Classroom Training: 5 days (7hrs per day)
Course Objectives
- Master advanced formulas and functions including array formulas, INDEX-MATCH variations, and dynamic references.
- Analyze and manage complex data sets using advanced filtering, sorting, and consolidation tools.
- Leverage PivotTables and PivotCharts with custom calculations, slicers, and timelines for interactive analysis.
- Transform and cleanse data with Power Query by connecting to external sources and applying advanced transformations.
- Create impactful data visualizations through advanced charting techniques, dashboards, and interactive controls.
- Apply scenario analysis and optimization tools such as Scenario Manager and Goal Seek for informed decision-making.
- Automate tasks with Macros and VBA to streamline workflows, build custom functions, and design user forms.
- Develop dynamic dashboards and reports that communicate insights clearly and effectively.
Course Outline
Module 1: Review of Basic Excel Functions
- Sum, Average, Count, Min, Max
- IF, VLOOKUP, HLOOKUP, INDEX-MATCH
- Logical Functions (AND, OR, NOT)
- Drop-down lists
- Custom data validation rules
- Dynamic validation with INDIRECT
Module 2: Data Analysis Tools
- Custom sorting options
- Advanced filtering techniques
- Sorting and filtering with tables
- Combining data from multiple sheets
- Consolidating data using PivotTables
Module 3: Advanced PivotTable Techniques
- Creating basic PivotTables
- Changing layout and design options
- Creating custom calculations
- Working with calculated items
- Enhancing interactivity with slicers
- Using timelines for date filtering
Module 4: Power Query and Data Transformation
- Connecting to external data sources
- Basic data transformations
- Merging and appending queries
- Advanced data cleansing techniques
Module 5: Data Visualization with Advanced Charts
- Title, axis labels, and legends
- Data labels and annotations
- Miniature charts within cells
- Visualizing trends and variations
Module 6: Advanced Formulas and Functions
- Understanding array concepts
- Array functions and formulas
- INDEX-MATCH-MATCH
- OFFSET, INDIRECT, CHOOSE
Module 7: Scenario Manager and Goal Seek
- Building different scenarios
- Comparing and evaluating scenarios
- Setting and solving optimization problems
- Identifying constraints and variables
Module 8: Automation with Macros and VBA
- Recording and running macros
- Variables, loops, and conditions
- Custom functions and procedures
- Automating repetitive tasks
- Creating interactive user forms
Module 9: Excel Dashboards
- Layout, color schemes, and readability
- Effective use of charts and visuals
- Dynamic charts and slicers
- Using form controls for interactivity
Note: The specific content, activities, and duration of each session may be adjusted based on the target audience, learning objectives, and available time.
Course Language
English
Training Methodology
Presentations are well guided, practical exercise, a plenary presentation, and group work. Participants are encouraged to bring any data relevant to their job responsibilities. This is hands-on, product-oriented training and will mostly involve practical exercises. Each participant MUST bring along their own working laptop and android phone.
Certification
Upon completion of training, the participant will be issued with a certificate of Completion.
Frequently Asked Questions
Common questions about the Training Course on Advanced Excel course.
Advanced Excel goes beyond basic formulas to use lookup functions (INDEX-MATCH, XLOOKUP), pivot tables, Power Query for data transformation, Power Pivot for in-memory data models, dynamic arrays, conditional logic, and macros (VBA). For NGOs and corporate teams, advanced Excel handles cleaning donor disbursement reports, automating monthly burn-rate dashboards, consolidating multi-country data, building three-statement financial models, and producing compliance-grade reports. Many finance and M&E roles still rely on Excel as the daily tool — making advanced fluency more practical than learning a separate BI platform.
The most powerful advanced Excel functions for data analysis include: XLOOKUP and INDEX-MATCH (replacing VLOOKUP for flexible lookups), SUMIFS / COUNTIFS / AVERAGEIFS (multi-criteria aggregation), Power Query (M language for data transformation pipelines), pivot tables and pivot charts, dynamic arrays (SORT, FILTER, UNIQUE), LET and LAMBDA (custom function creation), and conditional formatting with formula rules. Combined with structured tables (Excel Tables), these functions handle 90% of typical NGO M&E and finance analysis without external software.
Power Query is Excel's built-in tool for connecting to data sources (databases, web APIs, files, folders), transforming the data with a no-code/low-code interface, and loading the cleaned result into worksheets or the data model. Once a query is built, it can be refreshed automatically — turning hours of manual data cleaning into seconds. Power Query handles deduplication, pivoting/unpivoting, joining tables, splitting columns, and removing nulls — operations that would otherwise require Stata, R, or Python. It's now also embedded in Power BI.
Analysts, finance professionals, HR and payroll managers, operations leads and senior admin staff who rely on Excel as their primary daily tool and want to automate repetitive work, handle larger datasets, and build audit-ready workbooks.
Array formulas and dynamic arrays, XLOOKUP and advanced INDEX/MATCH, advanced PivotTables and PowerPivot, Power Query for data cleaning, macros and VBA fundamentals, complex conditional formatting, dashboard design, data modelling, and best-practice workbook structure.
Yes — solid intermediate Excel is expected. You should be comfortable with PivotTables, VLOOKUP, nested IFs and basic charts. If that sounds unfamiliar, our Intermediate Excel course is the right starting point.
Online and in-person at our training venues across Nairobi, Kigali, Mombasa, Lagos, Cape Town, Addis Ababa, Juba, Cairo and Dubai. Both formats are hands-on. Both issue the Perk Group Africa certificate of completion with a verification code.
Related Courses
Explore more courses in Data Management & Analysis