Data Management & Analysis
About our Data Management & Analysis training
Perk Group Africa delivers hands-on data analytics and statistics training for professionals who work with data every day. Courses cover Microsoft Power BI (DAX, dashboards, data modeling), Tableau, advanced Microsoft Excel (PivotTables, Power Query, macros, financial modeling), Stata for researchers, R for statistical computing, NVivo for qualitative analysis, and SPSS fundamentals. Training is scenario-based — participants build real dashboards, clean real datasets and practice the analytical workflows used by M&E officers, data analysts, BI professionals, researchers, finance teams and consultants across humanitarian, development and private-sector organisations. Courses run both online (live-instructor-led over Zoom) and in-person at our training venues across Nairobi, Kigali, Mombasa, Lagos, Cape Town, Addis Ababa, Juba, Cairo and Dubai, each with a certificate of completion.
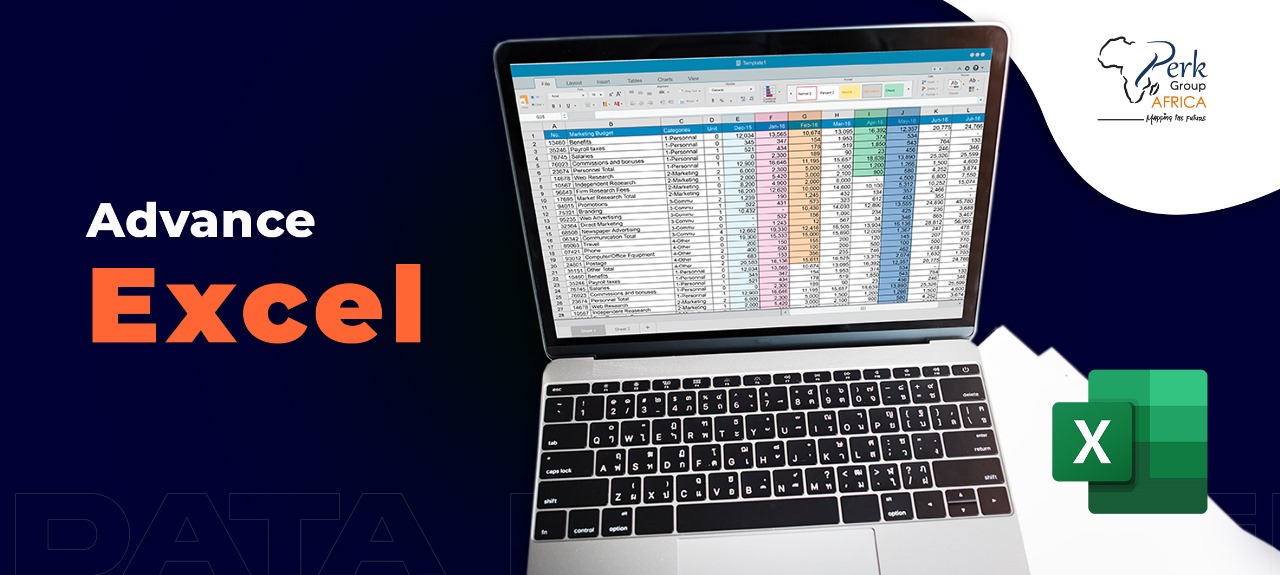
Training Course on Advanced Excel
This Advanced Excel course offers a practical approach to mastering the advanced features and functionalities of Microsoft Excel. Through a combination of hands-on exercises, real-world examples, and...
REGISTER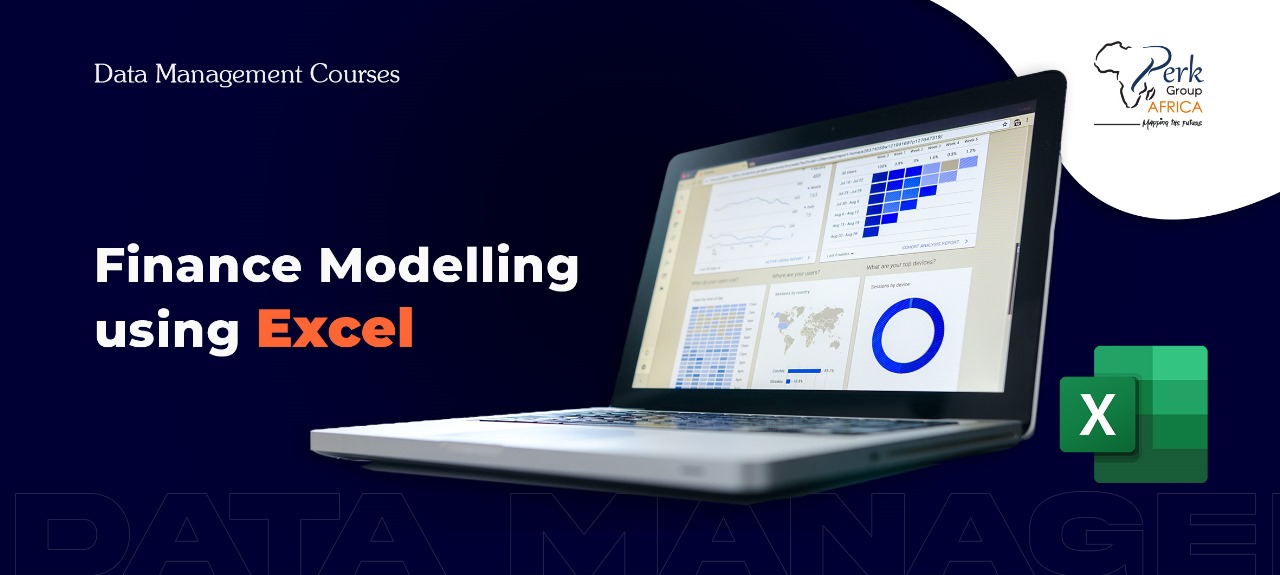
Training Course on Advanced Financial Modeling with Excel
The Financial Modeling Using Microsoft Excel course is a comprehensive, hands-on training designed to equip participants with practical skills to build robust financial models for analysis, forecastin...
REGISTER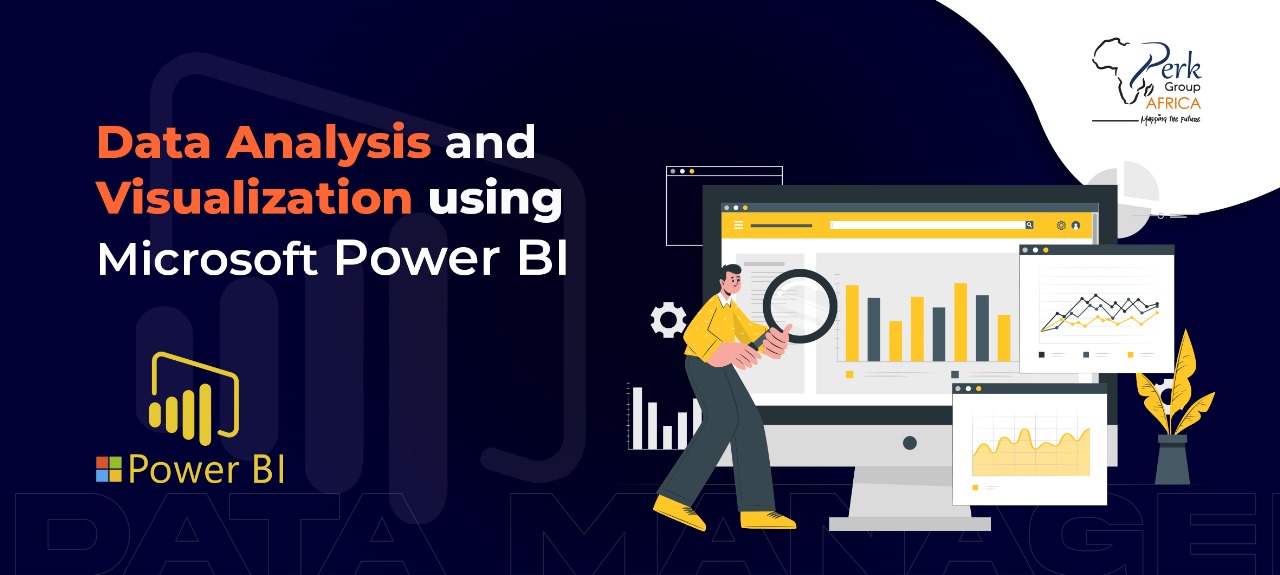
Training Course on Data Analysis and Visualization using Microsoft Power BI
The Data Analysis and Visualization using Microsoft Power BI course is designed to introduce participants to Microsoft Power BI, from the basics of operating the tools, through to advanced data analys...
REGISTER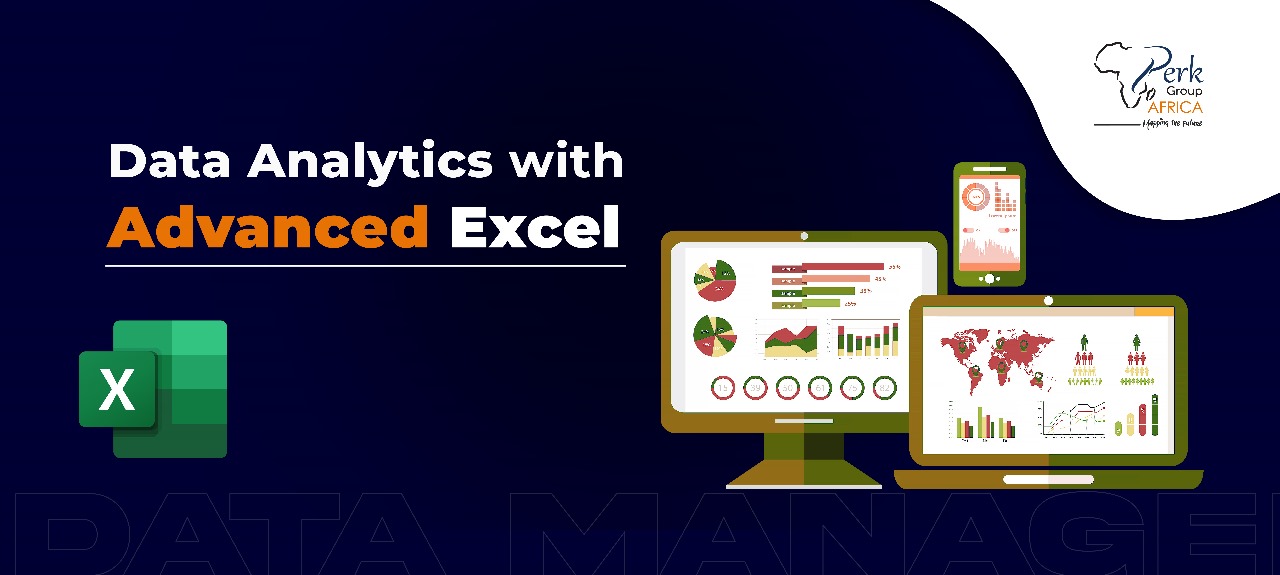
Training Course on Data Analytics with Advanced Excel
The Data Analytics with Advanced Excel training offers a comprehensive exploration of Excels capabilities in data analysis. Throughout the course, you will delve into advanced techniques for cle...
REGISTER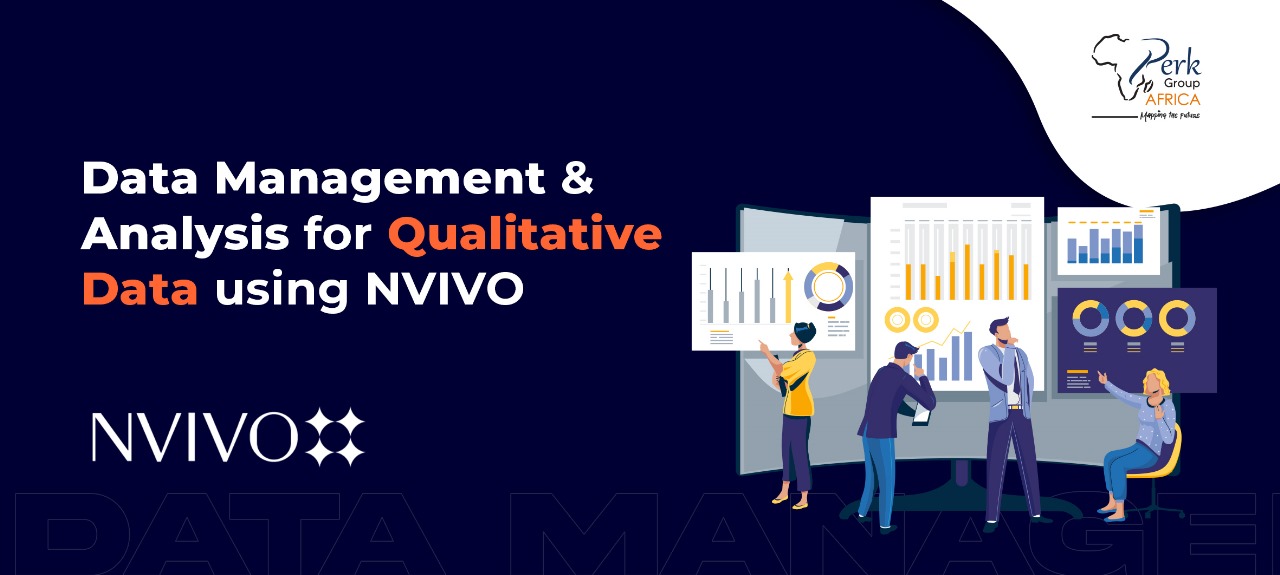
Training Course on Data Management and Analysis for Qualitative Data using NVivo
The Data Management and Analysis for Qualitative Data using NVivo is designed to empower participants with the skills required for effective qualitative data management and analysis using NVivo....
REGISTER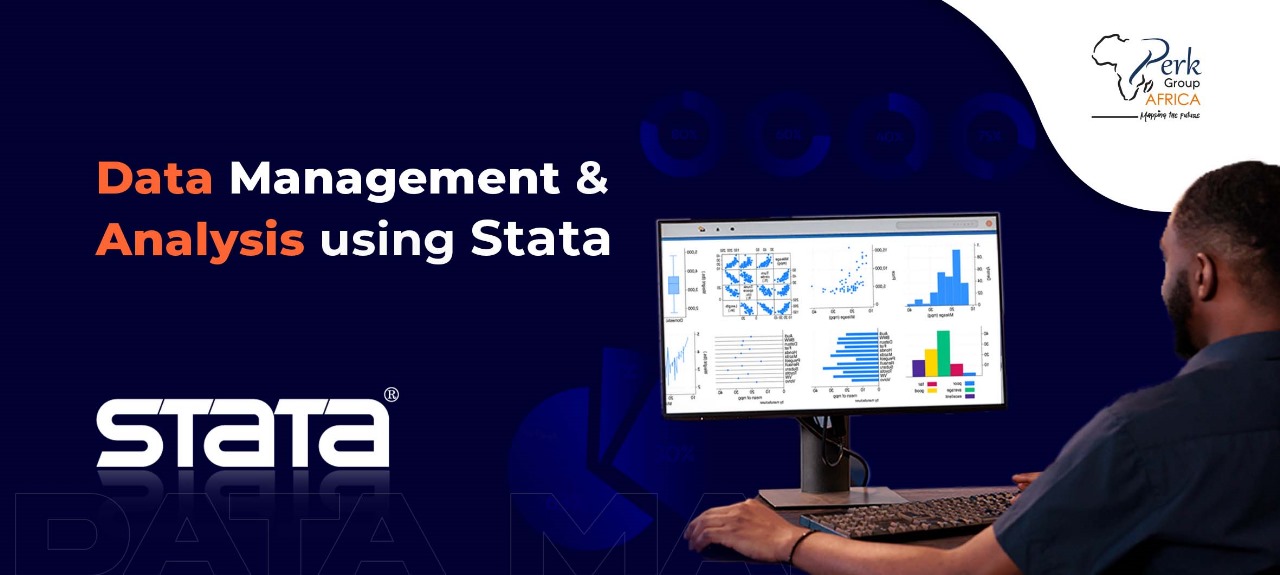
Training Course on Data Management and Analysis using Stata
This Data Management and Analysis using Stata course offers a concise and comprehensive approach to mastering the essential skills and techniques for managing and analyzing data using Stata software....
REGISTER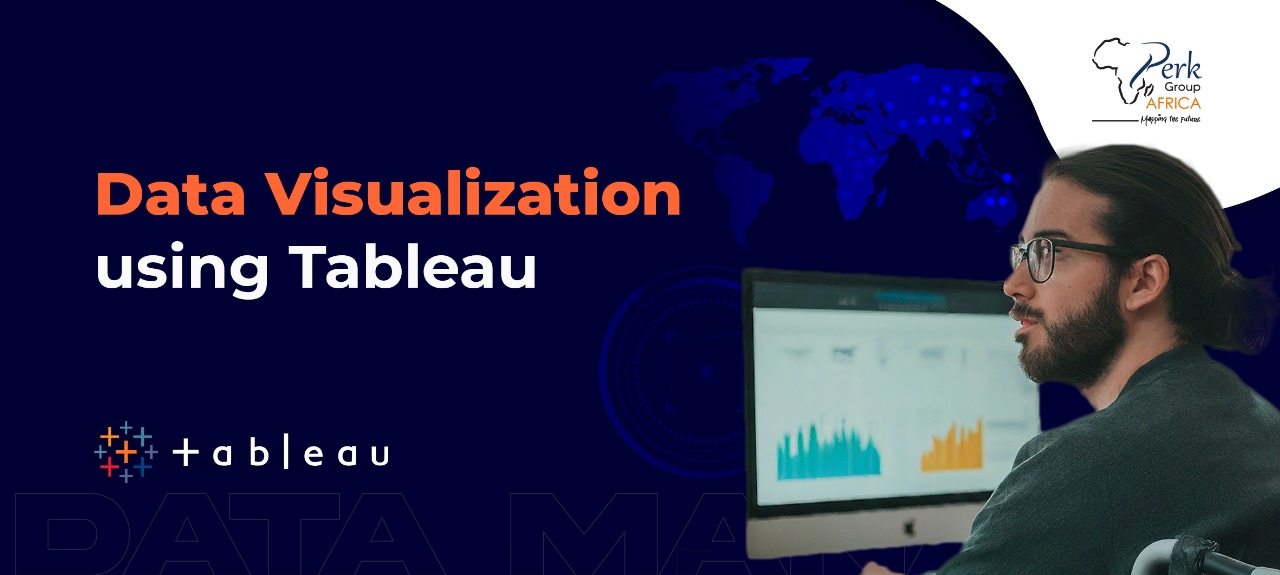
Training Course on Data Visualization using Tableau
The Data Visualization using Tableau training is designed to equip participants with essential skills in leveraging Tableau for effective data visualization and analysis. The participants will be expo...
REGISTER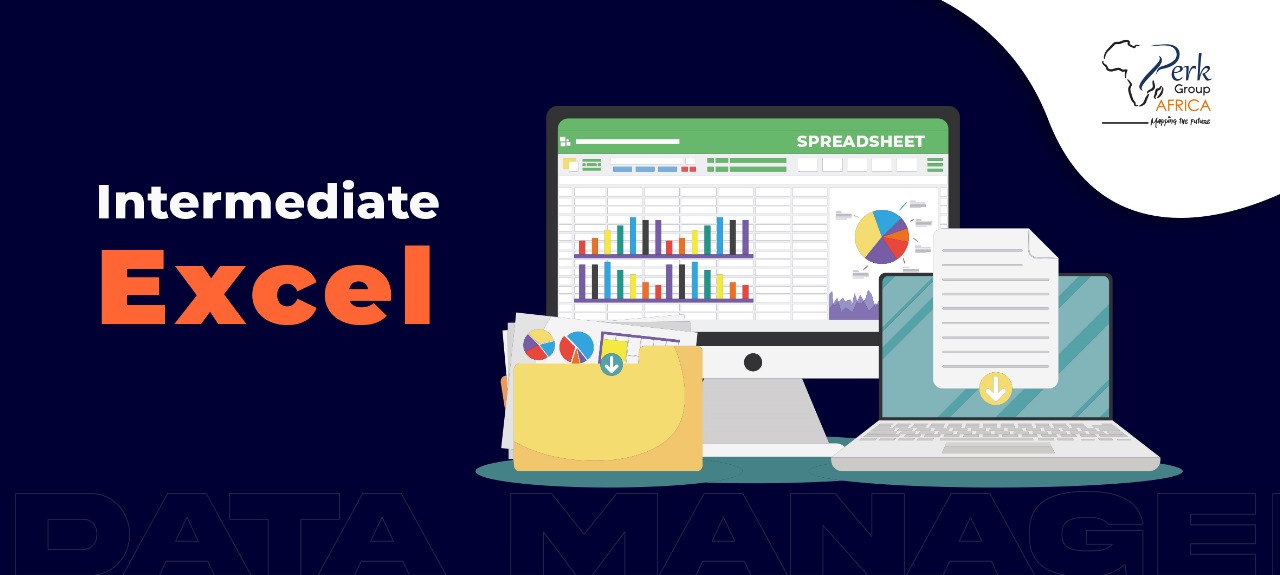
Training Course on Intermediate Excel
This course is fundamentally designed to improve participants’ skills and knowledge in Microsoft excel. The course will equip participants with the essential skills to boost their productivity, improv...
REGISTER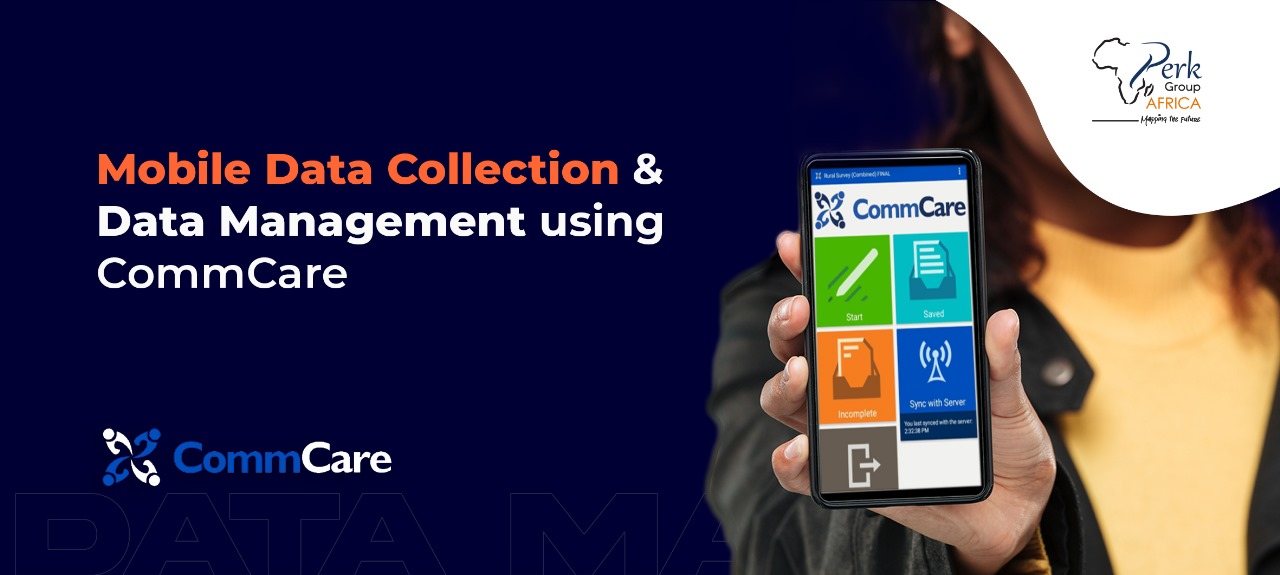
Training Course on Mobile Data Collection and Data Management using CommCare
This course is designed to equip participants with the necessary skills to leverage CommCare, a robust mobile data collection platform, for streamlined data collection, management, and analysis....
REGISTER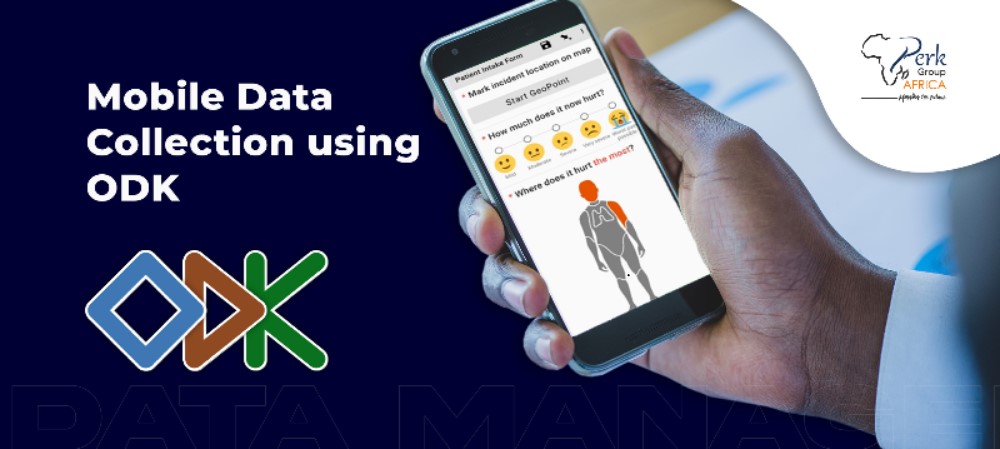
Training Course on Mobile Data Collection using ODK
The Mobile Data Collection Using Open Data Kit (ODK) course is designed to equip participants with practical knowledge and hands-on skills to efficiently collect, manage, and analyze data using mobile...
REGISTER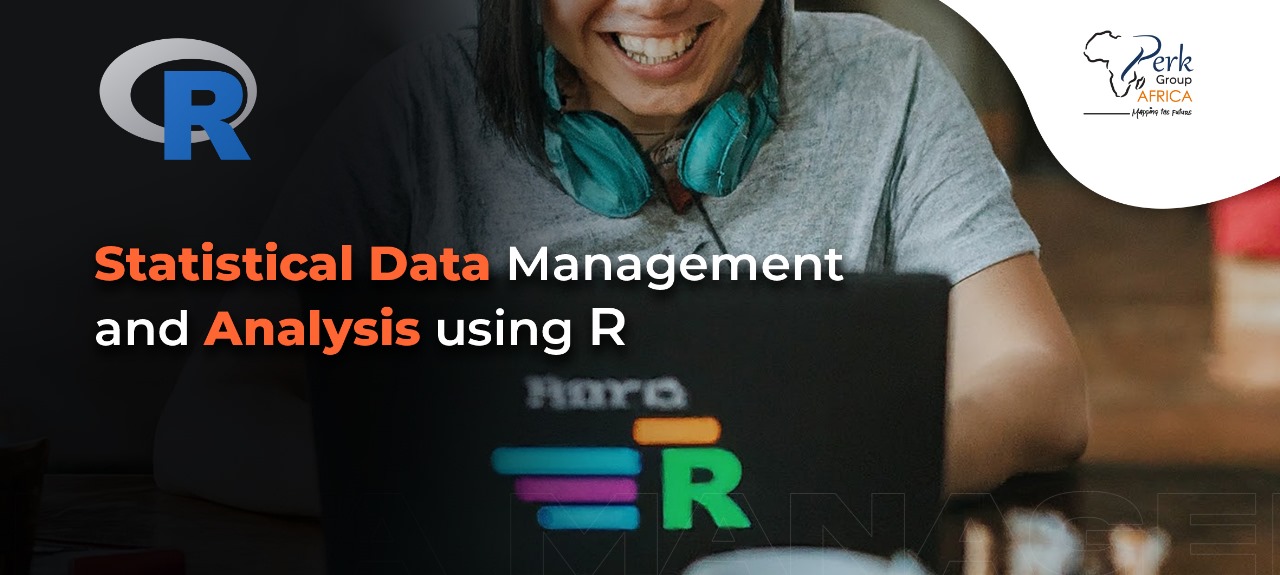
Training Course on Statistical Data Management and Analysis using R
The Statistical Data Management and Analysis using R training provides a comprehensive introduction to leveraging the R programming language for effective data manipulation, exploration, and sta...
REGISTERData Management & Analysis — Key Concepts Explained
The definitions and frameworks our data management & analysis training is built on.
Data analysis is the systematic examination of data to draw conclusions, support decisions and demonstrate results. In development programming, it spans descriptive analytics (what happened — disaggregated participant counts, output rates), diagnostic analytics (why — comparing trends, segmenting populations), and predictive/prescriptive analytics (what next — modelling outcomes, optimising interventions). Strong data analysis underpins MEAL, donor reporting, advocacy and adaptive management. Fluency in tools (Excel, Stata, R, Power BI), in research design (sampling, indicators), and in communicating findings to non-technical audiences are all essential competencies.
Quantitative data analysis works with numbers — survey responses, indicator scores, financial figures — using statistical methods to test hypotheses, measure change, and compare groups. Qualitative data analysis works with text — interview transcripts, focus group discussions, open-ended responses, observation notes — using coding, thematic analysis and pattern identification to understand meaning, context and lived experience. Most rigorous development M&E uses both (mixed methods): quantitative answers "what" and "how much", qualitative answers "why" and "how". Software like NVivo, Atlas.ti, Stata and R support each approach.
Mobile data collection is the use of smartphones and tablets to gather field data — surveys, monitoring forms, baseline data, beneficiary registration — replacing paper forms. ODK (Open Data Kit) is the open-source standard underlying many tools; CommCare adds case management for community health workers; KoBoToolbox is widely used by humanitarian agencies. Mobile data collection improves data quality through validation rules, cuts data entry time, supports GPS/photo capture, and accelerates decision-making by syncing data to dashboards within hours rather than weeks.
Stata and R are the two most widely-used statistical software packages in development research and academia. Stata is favoured for its user-friendly syntax, dominant in economics, public policy and impact evaluation; commands like regress, xtreg and ivregress run regression analysis quickly. R is open-source, free, and dominant in data science with thousands of community-contributed packages — particularly strong for visualisation (ggplot2), reproducible research (R Markdown) and machine learning. Most development M&E professionals benefit from at least basic fluency in one of the two.
Data visualization is the practice of representing data graphically — dashboards, charts, maps, infographics — to make patterns, trends and outliers immediately visible to decision-makers. Microsoft Power BI and Tableau are the two leading enterprise tools. Power BI integrates tightly with Microsoft 365 and is increasingly free for individual users; Tableau offers more advanced visual analytics. For NGOs, both tools turn programme data into donor-ready dashboards, board reports and public-facing impact stories. Strong visualization design balances clarity, accuracy and the principle that "less is more".
Advanced Excel goes beyond basic formulas to use lookup functions (INDEX-MATCH, XLOOKUP), pivot tables, Power Query for data transformation, Power Pivot for in-memory data models, conditional logic, dynamic arrays, and macros. For NGO data management, advanced Excel handles cleaning donor disbursement reports, automating monthly burn-rate dashboards, consolidating multi-country data, and producing compliance-grade reports. Many NGO finance and M&E roles still rely on Excel as the daily tool — making advanced fluency more practical than learning a new BI platform from scratch.